LOGs
The LOGs section documents the lab syslog integration and the Grafana dashboard used to centralize Nokia events.
Goal
This integration was designed to cover three needs in the lab:
- Centralize
SR OSandSR Linuxevents in one pipeline. - Filter quickly by platform, node, application, and event type.
- Reuse the existing
Grafanastack instead of adding a separate logging UI.
Components
| Component | Function |
|---|---|
Loki | Stores and indexes logs |
Alloy | Receives syslog, normalizes labels, and forwards to Loki |
Grafana | Visualizes logs and exposes the dashboard |
What this module documents
In this section you will find:
- the complete log pipeline architecture
- a block-by-block explanation of
configs/logs/config.alloy - a block-by-block explanation of
configs/logs/loki-config.yml - the syslog configuration applied on
SR OSandSR Linux - the retention impact and how default ephemeral storage works
- useful queries and operational validation steps
Access
| Service | URL | Credentials |
|---|---|---|
| Grafana | http://localhost:3030 | admin/admin |
| Loki API | http://localhost:3101 | N/A |
| Alloy UI | http://localhost:12345 | N/A |
General flow
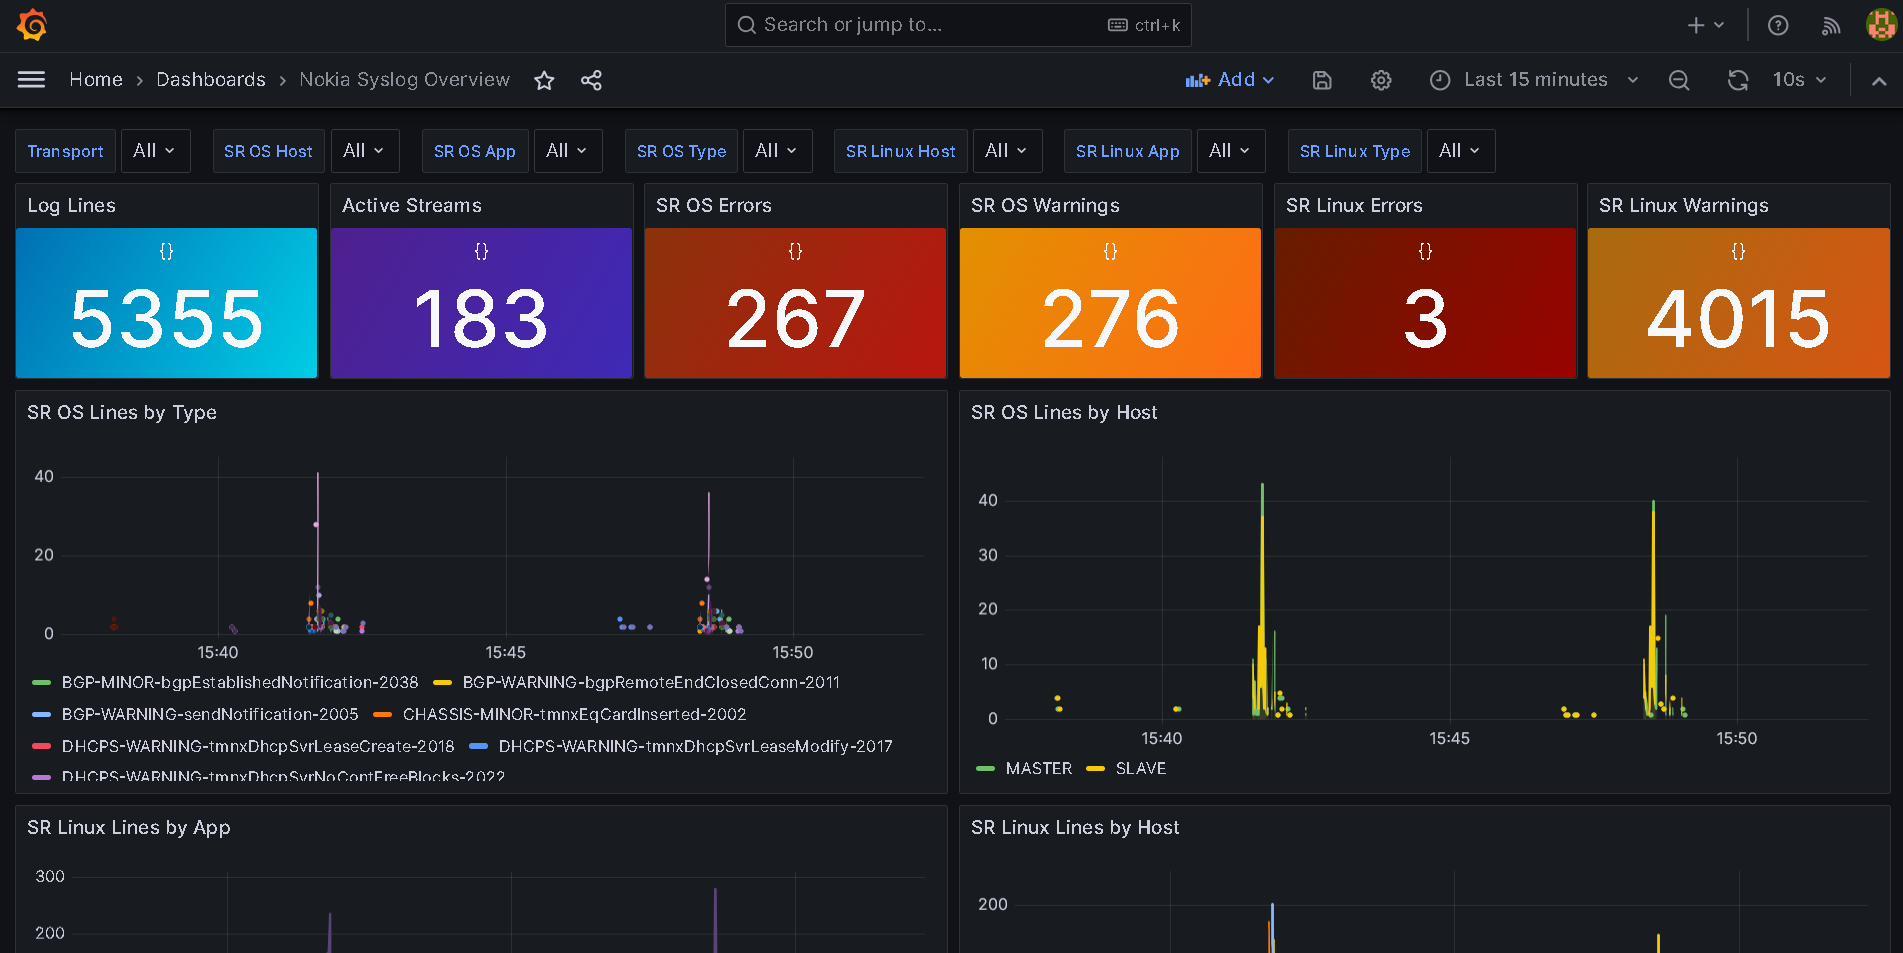
What the dashboard includes
The Nokia Syslog Overview dashboard is organized to operate both platforms from a single view:
- global counters for lines and streams
- separate metrics for
SR OSandSR Linux - dedicated filters for each platform
Raw Syslog - SR OSpanelRaw Syslog - SR Linuxpanel
Configuration applied on the nodes
SR OS
- sends syslog over
UDP/5514 - uses
facility local6 - uses
severity info - publishes the system name with
hostname use-system-name
SR Linux
- sends syslog over
UDP/1514 - uses
facility local6 - uses
match-above informational - publishes logs through the
mgmtnetwork-instance
In addition, grpc-server eda-mgmt was disabled on SR Linux nodes because it referenced a non-existent tls-profile "EDA" and generated continuous syslog noise.
Next page
The full technical logic, Loki labels, Alloy and Loki internals, queries, and platform-specific configuration details are documented in Dashboard and Integration.