12. Observability validation in Grafana and Prometheus
This test validates that traffic generated by subscribers ONT-001 and ONT-002 is correctly reflected in Prometheus and in the Small ISP Telemetry Grafana dashboard.
This validation does not use the LEA API. LEA is used for lawful interception and mirrored packets; throughput observability must be validated with Prometheus and Grafana.
For this validation, iperf3 in UDP mode with fixed bitrate is recommended, because it produces steadier and easier-to-see curves than TCP in this lab.
During the live validation of this ATP:
ONT-001produced non-zero octets onbngmaster-1ONT-002produced non-zero octets onbngmaster-1- both subscribers were visible in Prometheus under the
subscriber_subscriber_idlabel
12.1 Prepare the test server
The observability orchestrator automatically starts four iperf3 instances on the dns node, one per flow.
If you want to inspect port status before running the test:
bash configs/cbot/scripts/observability-traffic.sh status
12.2 Confirm that Prometheus sees both subscribers
List available subscriber_subscriber_id values:
curl -s 'http://10.99.1.10:9090/api/v1/label/subscriber_subscriber_id/values' | jq
The expected result must include:
["ONT-001", "ONT-002"]
Inspect active sessions:
curl -s 'http://10.99.1.10:9090/api/v1/query?query=subscriber_mgmt_subscriber_sla_profile_instance_session_up_time' \
| jq '.data.result[] | {subscriber:.metric.subscriber_subscriber_id, source:.metric.source, session_type:.metric.session_type, session_id:.metric.session_id, value:.value[1]}'
Expected result:
ONT-001appears assession_type="ipoe"ONT-002appears assession_type="ppp"
12.3 Generate simultaneous traffic from ONT-001 and ONT-002
Use the lab orchestrator:
bash configs/cbot/scripts/observability-traffic.sh all
The default profile generates four simultaneous flows:
ONT-001 ingress:2 Mbit/sONT-001 egress:2 Mbit/sONT-002 ingress:3 Mbit/sONT-002 egress:3 Mbit/s
It uses separate ports on dns to avoid the iperf3 server is busy error:
5201 -> ONT-001 ingress
5202 -> ONT-001 egress
5203 -> ONT-002 ingress
5204 -> ONT-002 egress
If the profile needs to be changed:
DURATION=30 \
ONT1_UP_BW=2M ONT1_DOWN_BW=2M \
ONT2_UP_BW=3M ONT2_DOWN_BW=3M \
IPERF_LEN=1200 \
bash configs/cbot/scripts/observability-traffic.sh all
At the end, the same script prints a Prometheus summary with IPv6 octet increases for both ingress and egress.
12.4 Validated profile
During live validation of this ATP:
ONT-001sustained2 Mbit/singress and2 Mbit/segressONT-002sustained3 Mbit/singress and3 Mbit/segressONT-002stayed aboveONT-001in both charts
12.5 Verify octet increase in Prometheus
The orchestrator already prints this summary automatically. If you want to query it again manually:
bash configs/cbot/scripts/observability-traffic.sh report
Expected result:
ONT-001must showoctets > 0onbngmaster-1for bothingressandegressONT-002must showoctets > 0onbngmaster-1for bothingressandegress
If you want the direct PromQL query for ingress:
curl -s 'http://10.99.1.10:9090/api/v1/query?query=sum%20by%20(subscriber_subscriber_id,source)%20(increase(subscriber_mgmt_subscriber_sla_profile_instance_ingress_qos_statistics_ipv6_forwarded_octets%7bsubscriber_subscriber_id=~%22ONT-001%7cONT-002%22%7d%5b5m%5d))' \
| jq '.data.result[] | {subscriber:.metric.subscriber_subscriber_id, source:.metric.source, octets:.value[1]}'
And for egress:
curl -s 'http://10.99.1.10:9090/api/v1/query?query=sum%20by%20(subscriber_subscriber_id,source)%20(increase(subscriber_mgmt_subscriber_sla_profile_instance_egress_qos_statistics_ipv6_forwarded_octets%7bsubscriber_subscriber_id=~%22ONT-001%7cONT-002%22%7d%5b5m%5d))' \
| jq '.data.result[] | {subscriber:.metric.subscriber_subscriber_id, source:.metric.source, octets:.value[1]}'
12.6 Validate in Grafana
Open Grafana:
- URL:
http://localhost:3030 - Dashboard:
Small ISP Telemetry - Time range:
Last 5 minutes - Refresh:
5s
Select:
Node = bngmaster-1Subscriber = ONT-001
Select:
Node = bngmaster-1Subscriber = ONT-001 + ONT-002
Expected result:
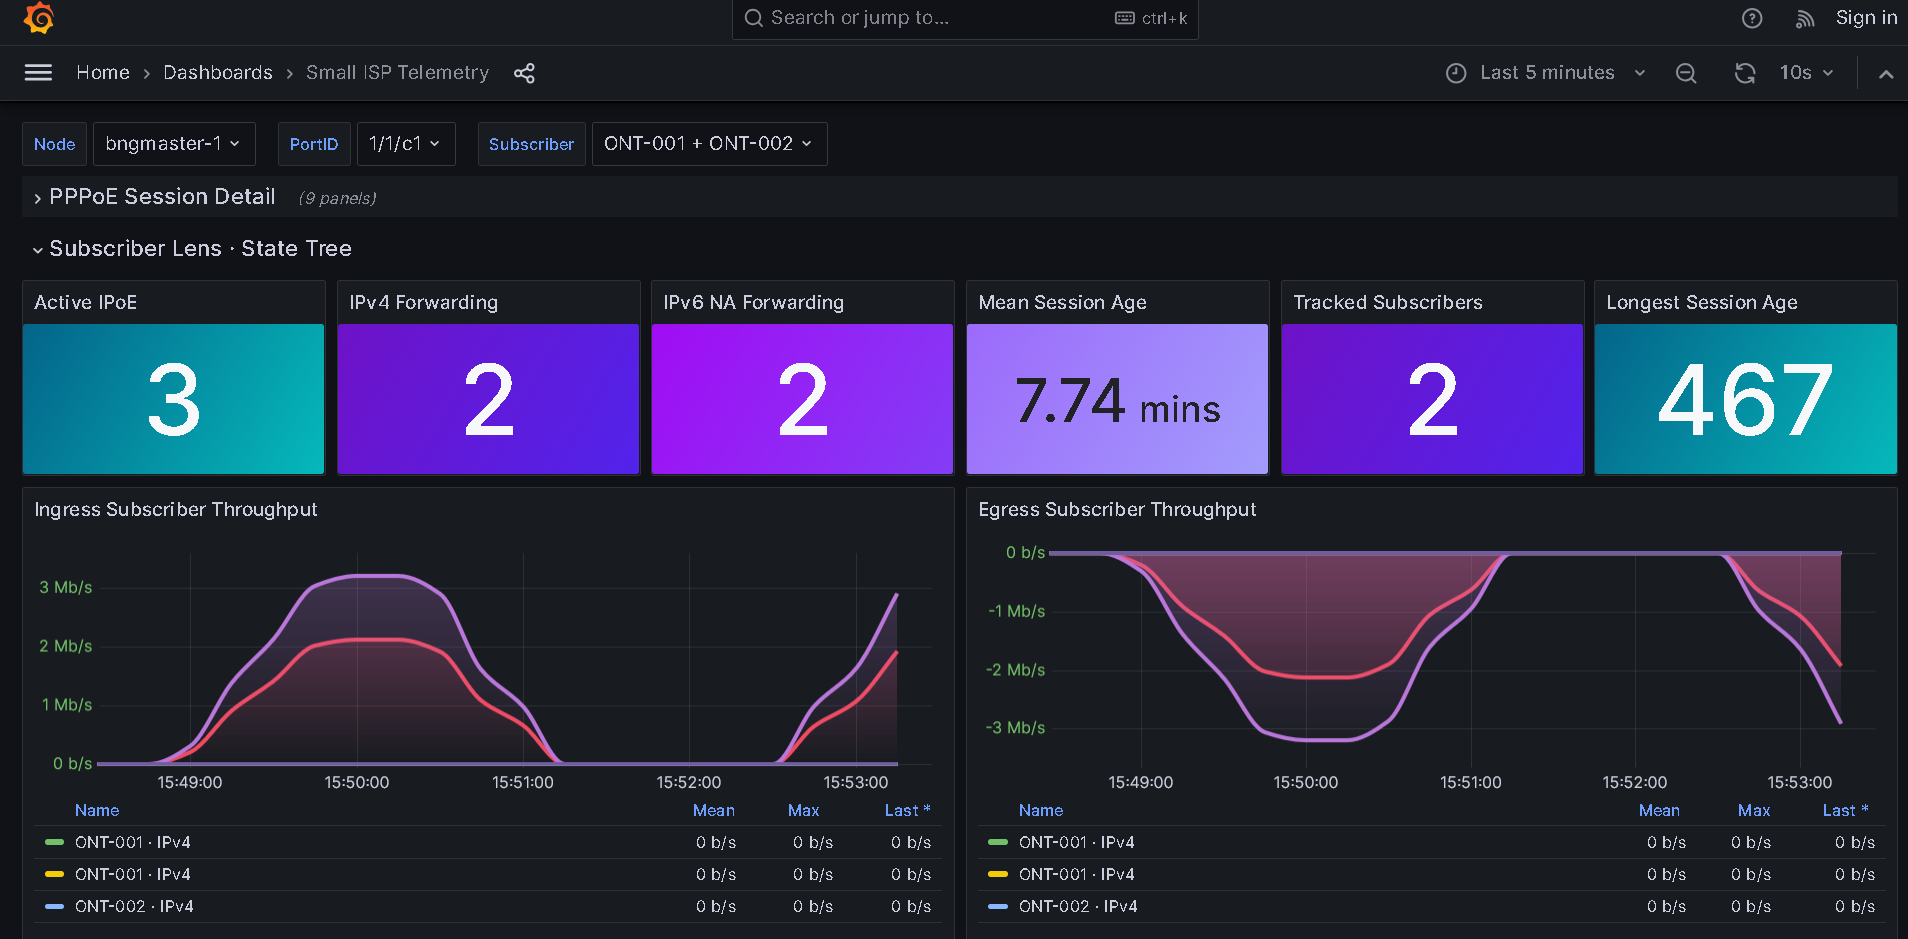
- the
Subscriber Lens · State Treeblock shows both subscribers Ingress Subscriber ThroughputshowsONT-002aboveONT-001Egress Subscriber ThroughputshowsONT-002aboveONT-001- curves remain sustained for the full test duration
12.7 Visual reference
Use the Grafana dashboard screenshot attached to this validation as the visual reference for the Subscriber Lens · State Tree panel and the throughput charts.
12.8 Cleanup
Stop the orchestrator servers:
bash configs/cbot/scripts/observability-traffic.sh stop-servers
Inspect port status:
bash configs/cbot/scripts/observability-traffic.sh status
12.9 Operational notes
ONT-001andONT-002are observed in the same dashboard by changing only theSubscriberselector.- If
ONT-002 ingressends withunable to read from stream socket: Resource temporarily unavailable, in this lab it is treated as a transientiperf3close as long as Prometheus still shows octet increase. - If the dashboard shows no activity, validate first in Prometheus that
increase(...)returns non-zero octets. - In this topology the useful activity is visible on
bngmaster-1; during validation,bngslave-1remained at zero for these counters. - To make spikes easier to see, use a short Grafana window (
Last 5 minutes) and fast refresh (5s). - For sustained observability, use
configs/cbot/scripts/observability-traffic.shinstead of launching manual tests independently. - The default profile already keeps
ONT-002aboveONT-001in bothingressandegress.